
We have a beautiful new skin and want to learn to use graphs in jamroom for it. Could you provide an example on how to use them. There just isn't much documentation on them available and it would be cool to add them to our panels. Thanks
updated by @developer-networks: 04/22/24 02:40:37PM
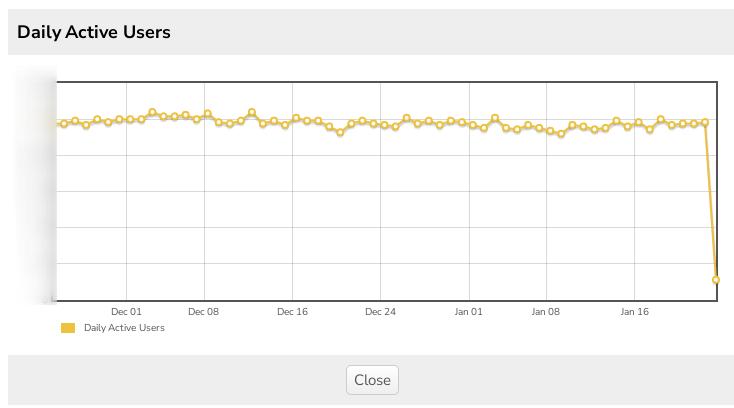
Graphs in Jamroom
Here's the example from the "Daily Active Users" graph:
In the _init() function
The title and the function are defined.
Then the structure for the data set is setup in that function:
Then it can be turned on in the dashboard.
The graphing module is Flot, its docs are here
http://www.flotcharts.org/

In the _init() function
    // Graph Support
    $_tmp = array(
        'title'    => 'Daily Active Users',
        'function' => 'jrUser_graph_daily_active_users',
        'group'    => 'admin'
    );
    jrCore_register_module_feature('jrGraph', 'graph_config', 'jrUser', 'daily_active_users', $_tmp);
Then the structure for the data set is setup in that function:
 * Daily Active Users
 * @param $module string Module
 * @param $name string Name of Graph to create
 * @param $_args array Passed in Parameters
 * @return array
 */
function jrUser_graph_daily_active_users($module, $name, $_args)
{
    $dys = (int) $_args['days'];
    $old = (time() - ($dys * 86400));
    $old = jrCore_format_time($old, false, '%Y%m%d');
    return array(
        '_sets' => array(
            0 => array(
                'label'       => "Daily Active Users",
                'date_format' => '%m/%d/%Y',
                'minTickSize' => "[1, 'day']",
                'type'        => 'line',
                'pointRadius' => 3,
                '_data'       => jrCore_get_graph_stat_values('jrUser', 'active_users', 'daily', $old)
            )
        )
    );
}
Then it can be turned on in the dashboard.
The graphing module is Flot, its docs are here
http://www.flotcharts.org/