Suddenly very slow performance – SLOOOOOW database performace

Clay Gordon
Clay Gordon
@claygordon
2 weeks ago
733 posts
I got a notice from Uptime Robot this morning that my JR site (hosted on Contabo) was unreachable for nearly ten minutes.

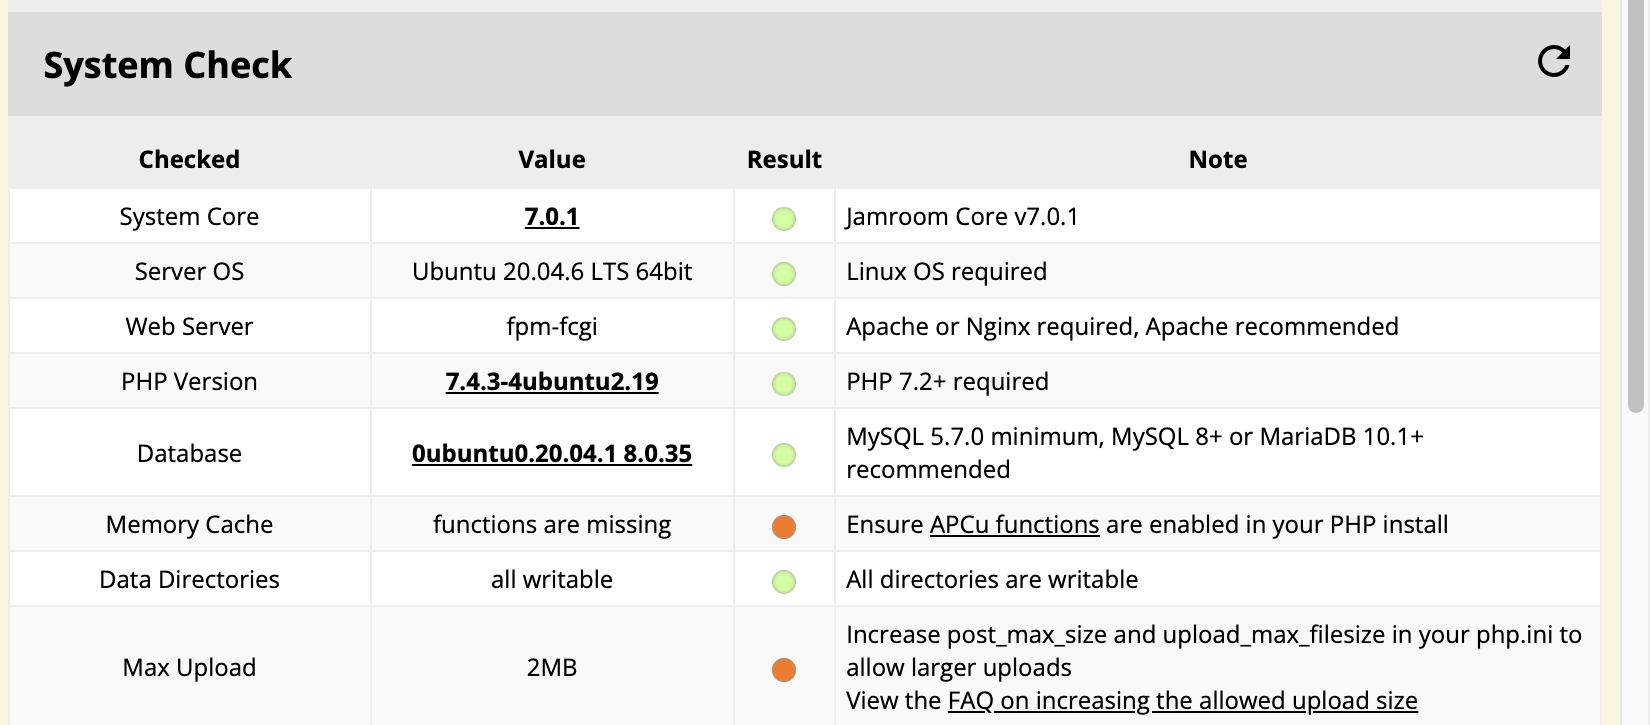
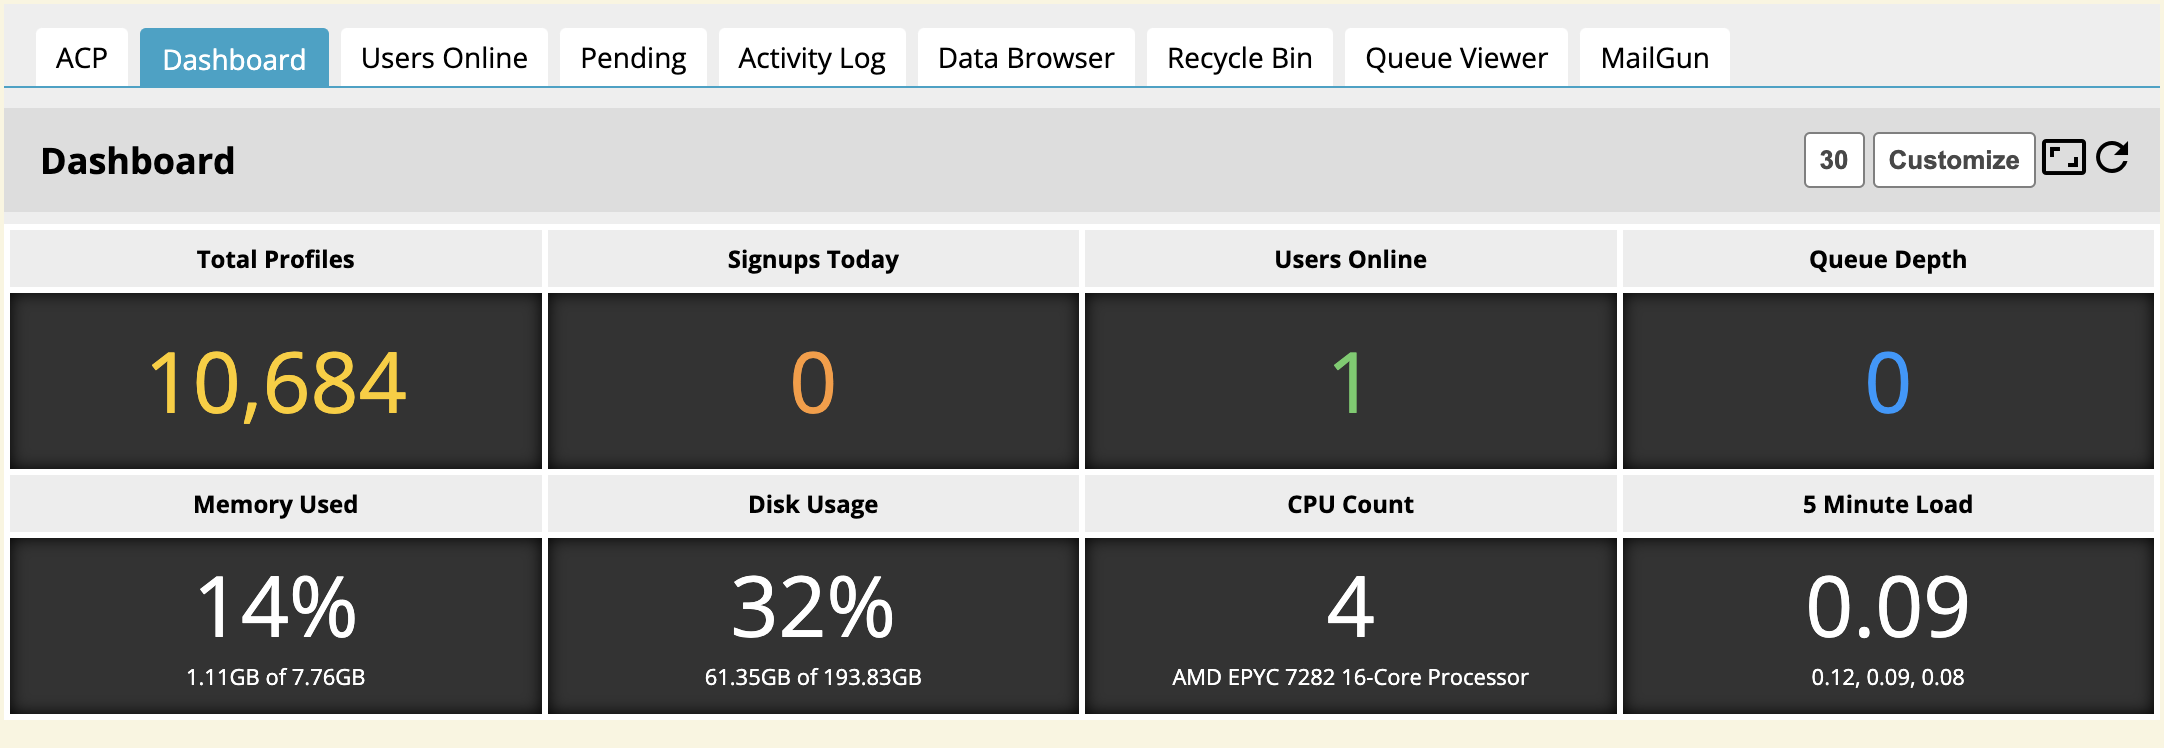
We ran a server check and it seems to be running smoothly.
I did a database integrity check and it came back okay.

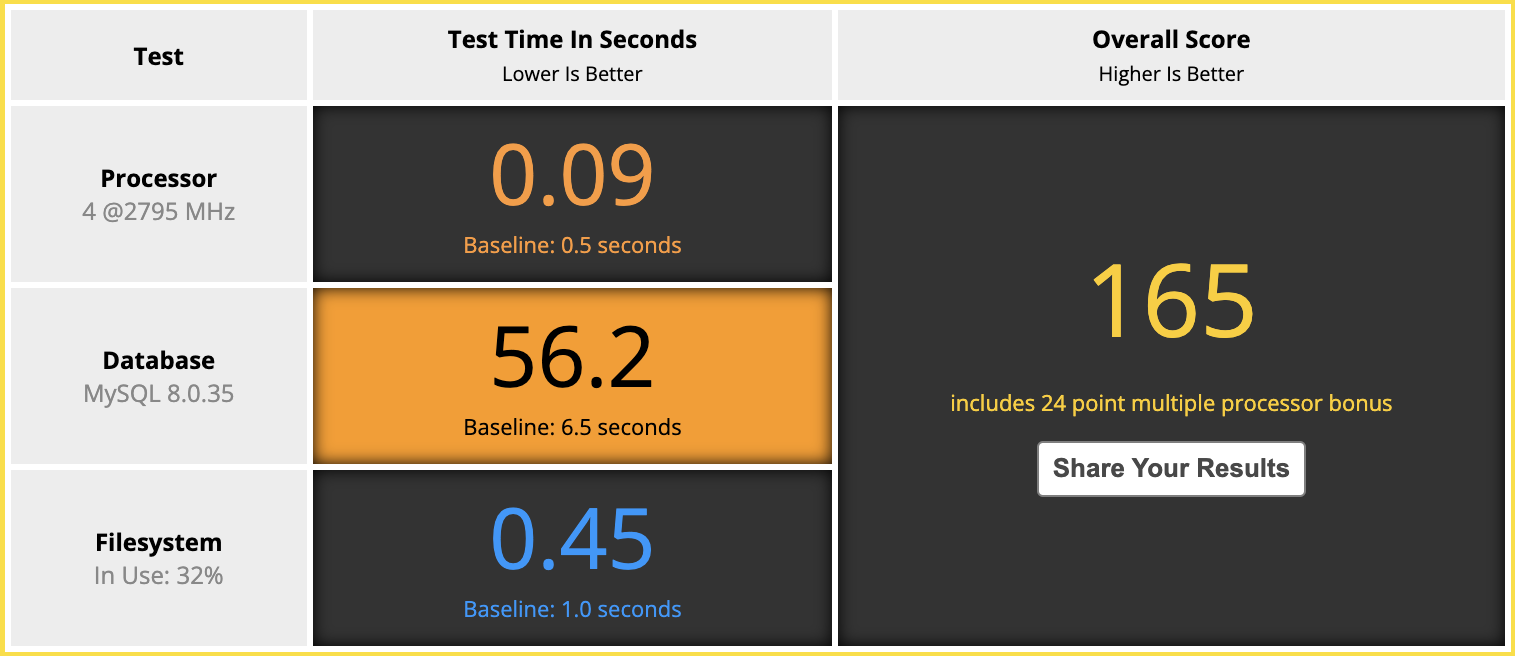
I am doing an optimize tables and the following appear to be taking a very long time each – I am wondering if any of the following message points to a source of the problem? And if yes, what to do about them.

optimizing table: jr_jrcore_log_201901 .... optimizing table: jr_jrcore_log_202401
optimizing table: jr_jrcore_log_debug (VERY long time, like forever).
optimizing table: jr_jruser_item_key
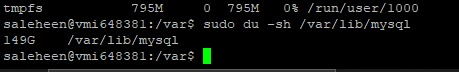
^It looks like I have sufficient free disk space.

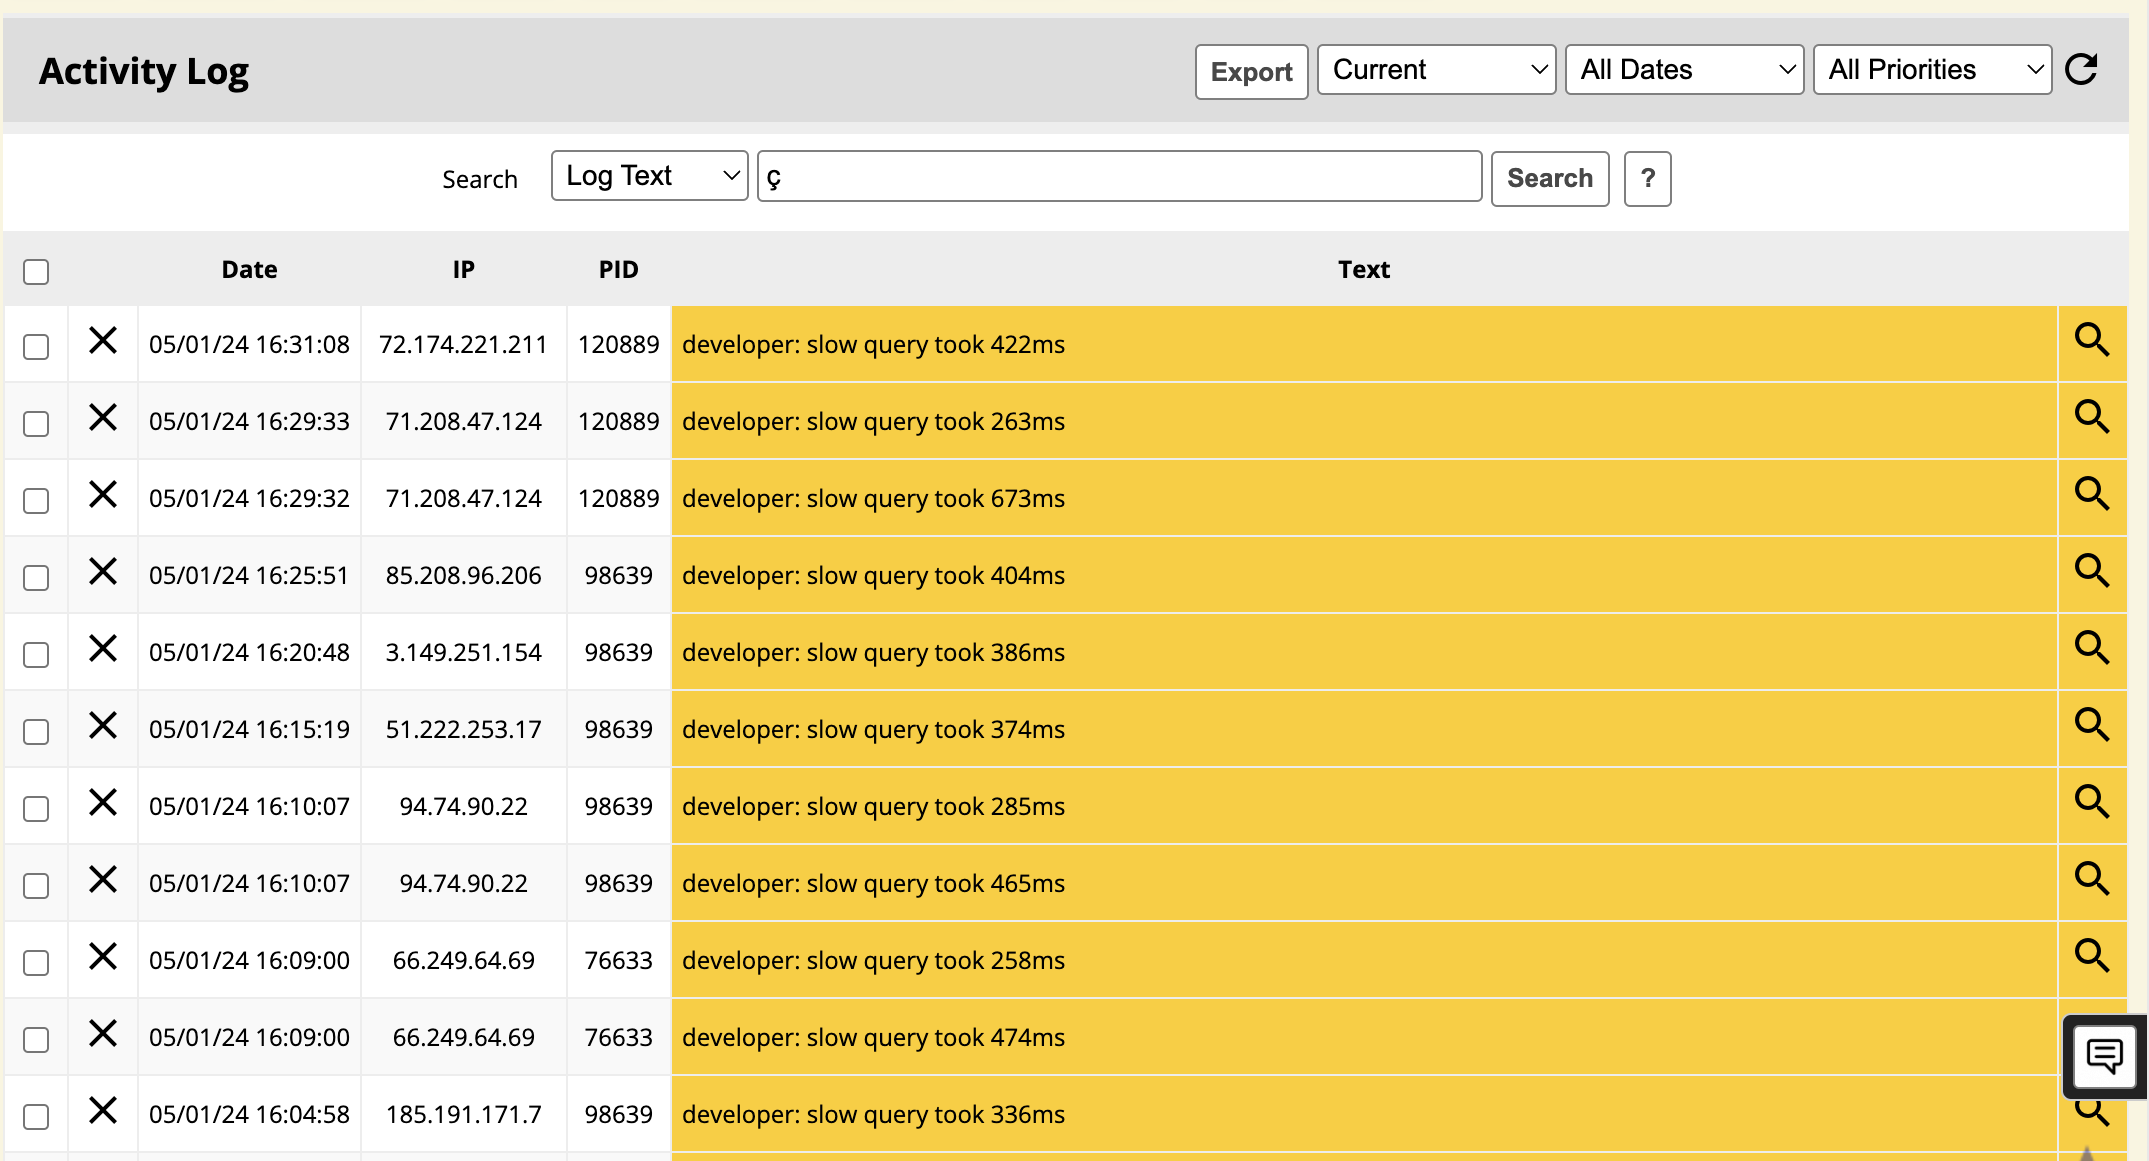
After optimizing tables I am still getting a DB Performance check rating of 58.76 with a baseline of 6.5.

This was working fine the last time I checked – a couple of days ago.

Do I need to repair tables?
brian
@brian
2 weeks ago
10,144 posts
No - repair tables or optimize tables are not going to help. You really don't ever need to run optimize/repair, since that mainly affects MyISAM tables, which JR has not use in a long time (some really old installs may still be using them however). My guess is that your MySQL server is not actually ON your server - since you're only using ~1G RAM, that would mean your InnoDB settings would be set for a very, very small server - I have a feeling your database server is not on the same physical server as your webhosting, and that the DB server is over loaded. Maybe give it some time and see if it improves?


--
Brian Johnson
Founder and Lead Developer - Jamroom
https://www.jamroom.net
Clay Gordon
Clay Gordon
@claygordon
2 weeks ago
733 posts
Brian -

Thanks. We will take a look at that. Is there a clue in the attached screenshot?
brian
@brian
2 weeks ago
10,144 posts
It's hard to tell - what you want to look at is the value for "jrCore_db_host" in your data/config/config.php file.

Also - I would _highly_ recommend you get APCu installed on your server - it's almost a requirement in Jamroom 7 and will make your site faster.

I know I probably already asked you this but have you thought about coming back to JR hosting? :)
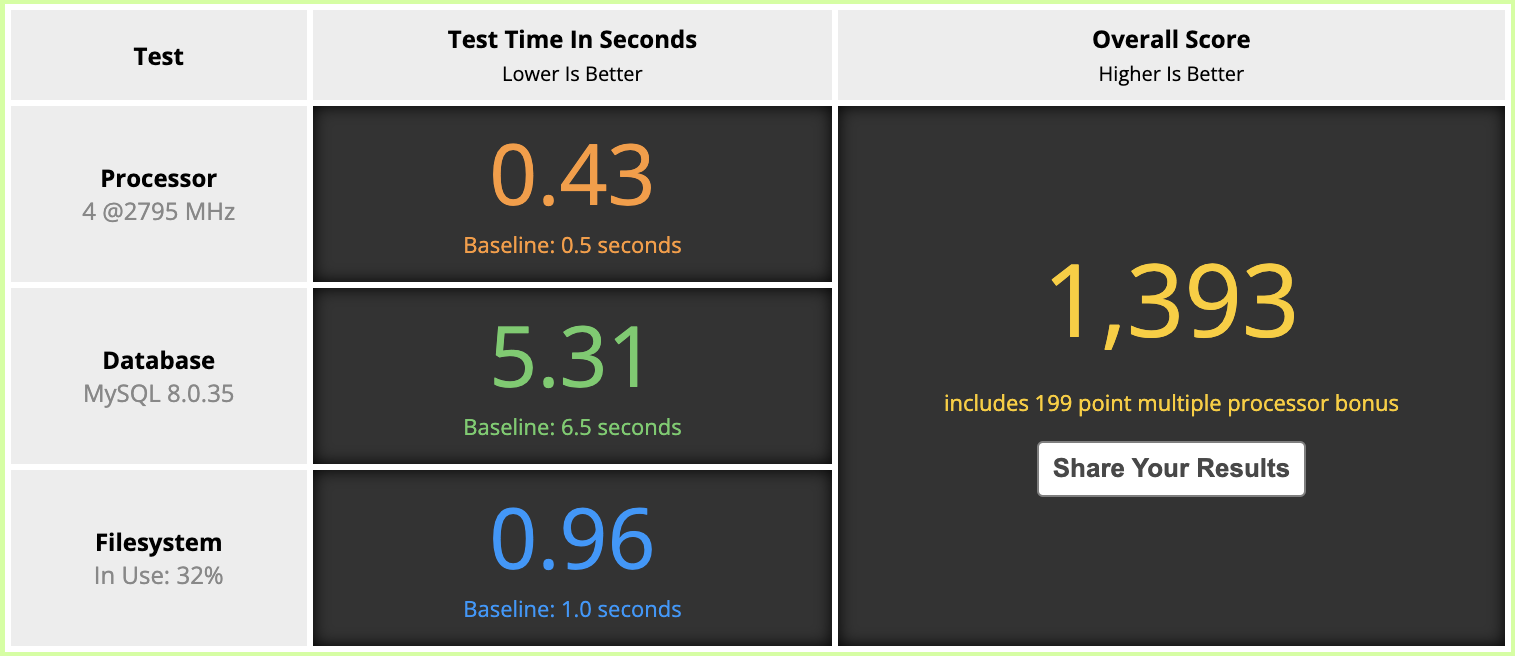
. We moved to new servers that are really, really fast.


--
Brian Johnson
Founder and Lead Developer - Jamroom
https://www.jamroom.net

updated by @brian: 04/26/24 09:43:51AM
Clay Gordon
Clay Gordon
@claygordon
2 weeks ago
733 posts
Brian –

This is the first performance anxiety issue on Contabo. If this persists then I will definitely consider moving back.
Clay Gordon
Clay Gordon
@claygordon
2 weeks ago
733 posts
Brian -

db_host is 127.0.0.1 – localhost, not remote. I am on a VPS.
brian
@brian
2 weeks ago
10,144 posts
OK yeah - then I'm not sure why that would be so slow - the system load appears fine (based on your screenshot). It could just be that the HOST your VM is on has a high load due to other VM's on the same server. Did your integrity check when you did the table optimization finish successfully?


--
Brian Johnson
Founder and Lead Developer - Jamroom
https://www.jamroom.net
Clay Gordon
Clay Gordon
@claygordon
2 weeks ago
733 posts
Brian -

The tech guy I work with – who also handles my Ghost development and hosting – is looking into local network/VM issues that may be affecting performance.

I don’t see an obvious system status dashboard so I am going to have to create a support ticket.

While it took a loooooooooooong time., table optimization was completed and I exited properly. One suggested upgrade to all of the checks would be to add an elapsed time in the completion dialog. Could be useful in diagnosing issues. The regular integrity check took about the amount of time I remember it taking.
michael
@michael
one week ago
7,697 posts
If optimizing your debug table took a long time, see whats in it. on my sites its almost always empty. If its filling up you might have left over debugging code in place.

Wipe out the activity log too if its big. Only really useful to help you understand whats going on at the moment. Pretty sure I've never gone back more than a month or so to see what was happening last month in the activity log.
Clay Gordon
Clay Gordon
@claygordon
one week ago
733 posts
Michael:

I have a lot of log tables. I just took a look at the Activity Log tab System Core - Global Config.

I have Developer Mode on. Not sure why.
Just before I took this screenshot (attached) PURGE was set to never.

I am going to set the purge to 1 day to force a purge ASAP then reset to 10 days and turn developer mode off.

What else should I consider?
DebugLogs.png
DebugLogs.png  •  144KB

Clay Gordon
Clay Gordon
@claygordon
one week ago
733 posts
Michael -

Right now, all of the Database Options are set to off. (Global Config-Database Options)

Would it help to turn these on for a couple of days to see what we might find?
michael
@michael
one week ago
7,697 posts
Developer mode is sure to be one of the issues causing your site to run slow. Turn that off for production. It causes caching to be switched off so developers can see whats happening when they change stuff without having to click RESET CACHES each time.
Clay Gordon
Clay Gordon
@claygordon
one week ago
733 posts
After making a bunch of changes, system performance feels much more responsive even though running the Performance Check still returns an absurdly big result (greater than 50). Looking at the activity log I see a lot of the following entries – most of them from the same IP addresses:

developer: slow query took 276ms (associated with AWS)
developer: slow query took 450ms (associated with Google)

Slow db query logging is turned off in Global Config

I am also getting the following when trying to take a look at the Error Log from the Dashboard:

Unable to process your request
The system has encountered an unrecoverable error - please try again shortly

AND I found a typo in a help message in Global Config • Developer Settings in the Developer Settings tab, Developer is misspelled:

If this option is enabled, additional tools for rebasing and resetting the system will appear in the Develope Tools -- Tools menu
Default: off
Clay Gordon
Clay Gordon
@claygordon
6 days ago
733 posts
Taking a look at the server, I see that my disk is now 99% full.

I am kind of wondering what might NOW be consuming 182 of 194GB of disk. When I reported this a couple of days ago the disk was showing 62GB in use.

I turned of the INF and DBG logging and put all the logs on a 3-day purge cycle. My developer tells me that most of the uptick in space usage is the DB.
Clay Gordon
Clay Gordon
@claygordon
6 days ago
733 posts
Oops - forgot this screenshot. The DB is now 149GB. Did I flip a toggle somehow?
brian
@brian
6 days ago
10,144 posts
Yeah something has changed is getting logged in to your DB. Are you seeing a lot of logs coming in to your activity log?


--
Brian Johnson
Founder and Lead Developer - Jamroom
https://www.jamroom.net
Clay Gordon
Clay Gordon
@claygordon
6 days ago
733 posts
Many developer: slow query took
core: 404 Page not found: that look to be spiders (favicon.ico e.g.)

The debug log is not that huge but there is this:


ACP
Dashboard
Users Online
Pending
Activity Log
Data Browser
Recycle Bin
Queue Viewer
MailGun
Activity Log
Debug Log
Error Log
Debug Log

(2024-04-29T15:24:03-06:00.0.40908500 : 0.036)-(mem: 4MB)-(pid: 3213661)-(ip: 51.222.253.3)-(sid: vri82g7q5npe7iudedn3djhilj)-(url: https://archive.thechocolatelife.com/angela-pettypiece/timeline/3219)
|core: recursive module trigger detected for jrCore/db_get_item|

and this:
(2024-04-29T15:24:03-06:00.0.40908500 : 0.036)-(mem: 4MB)-(pid: 3213661)-(ip: 51.222.253.3)-(sid: vri82g7q5npe7iudedn3djhilj)-(url: https://archive.thechocolatelife.com/angela-pettypiece/timeline/3219)
Array
(
[event] => db_get_item
[module] => jrCore
[trace] => Array

And this one

(2024-04-30T21:07:54-06:00.0.75795900 : 0.03)-(mem: 2MB)-(pid: 3912950)-(ip: 52.14.8.34)-(sid: g4kpt4f0880q8qu4svmeifhk9q)-(url: https://archive.thechocolatelife.com/jack-meyer/timeline/514)

With hundreds of lines after this – but not a huge file.
Clay Gordon
Clay Gordon
@claygordon
6 days ago
733 posts
I don’t know how many pages there are in the Activity Log there is no indicator – just the number of posts/page – but there appear to be LOTS of pages in the activity log. 100GB in a week?
brian
@brian
6 days ago
10,144 posts
Turn off the slow query log in Developer -> Global Config -> Database Options, although I'd be curious to see what is slow. Based on your performance test it sounds like your DB may not be configured very well (and the fact that you have ~7GB of RAM free also tells me your InnoDB settings are not likely correct for performance).

if you want to send me your admin login to support@jamroom.net I can let you know what is eating up the space.


--
Brian Johnson
Founder and Lead Developer - Jamroom
https://www.jamroom.net
Clay Gordon
Clay Gordon
@claygordon
6 days ago
733 posts
Brian:

The slow query log is disabled. I don’t think it has ever been set to a time.

I will get the admin log and email it to you.

Thanks!
Clay Gordon
Clay Gordon
@claygordon
6 days ago
733 posts
I have turned off slow query logging and query logging but they are still being logged.

developer: slow query took 422ms
Clay Gordon
Clay Gordon
@claygordon
6 days ago
733 posts
Also see attached
brian
@brian
6 days ago
10,144 posts
Those are not coming in nearly fast enough to be what is filling up your DB. Without logging in it's going to be hard to figure out what it is.


--
Brian Johnson
Founder and Lead Developer - Jamroom
https://www.jamroom.net
Clay Gordon
Clay Gordon
@claygordon
6 days ago
733 posts
Can I send you credentials to the support email? There is still an account for you – I need to refresh the password.
brian
@brian
6 days ago
10,144 posts
Clay Gordon:
Can I send you credentials to the support email? There is still an account for you – I need to refresh the password.

Yep - support@jamroom.net


--
Brian Johnson
Founder and Lead Developer - Jamroom
https://www.jamroom.net
Clay Gordon
Clay Gordon
@claygordon
3 days ago
733 posts
Brian - sent. However, once the disk filled again the system was unreachable.

We ended up doing a complete backup from the terminal, downloaded everything, wiped the disk, and then did a reinstall. Things appear to be looking good and the response is very fast.

However, I did notice some critical errors in the activity log. I am not sure if these are a remnant of something from the install.
Clay Gordon
Clay Gordon
@claygordon
3 days ago
733 posts
Brian -

I am monitoring disk space through the dashboard and it is slowly creeping up. 500mb increase in about 30 minutes.

The only logging activity is CRItical. All other logging is turned off.
There is one queue worker: ten_minute_maintenance

Tags